Python, Google Sheets, and Google Data Studio to Track the Number of Indexed Pages

If you are running a big website with a large number of pages and categories, you need to track the number of indexed pages on Google SERP at least every week. This will help you monitor the changes in your website and how they affect the number of indexed pages.
One of the first steps in the technical SEO audit is to check the number of indexed pages for your website on Google SERPs and compare them with your XML sitemap to see the difference between the numbers.
Most of the time, the numbers on Google SERPs will be different than your XML sitemap because it will include the paginations and sometimes other pages that you don't want to indexed, like search pages and facets.
By monitoring the number of indexed pages every week, you can fix your website's bugs and issues before they get worse.
How to Get the Number of Indexed Pages on Google
You can get the number of indexed pages on Google by using the search operator "site:" and adding the URL you want to track after it.
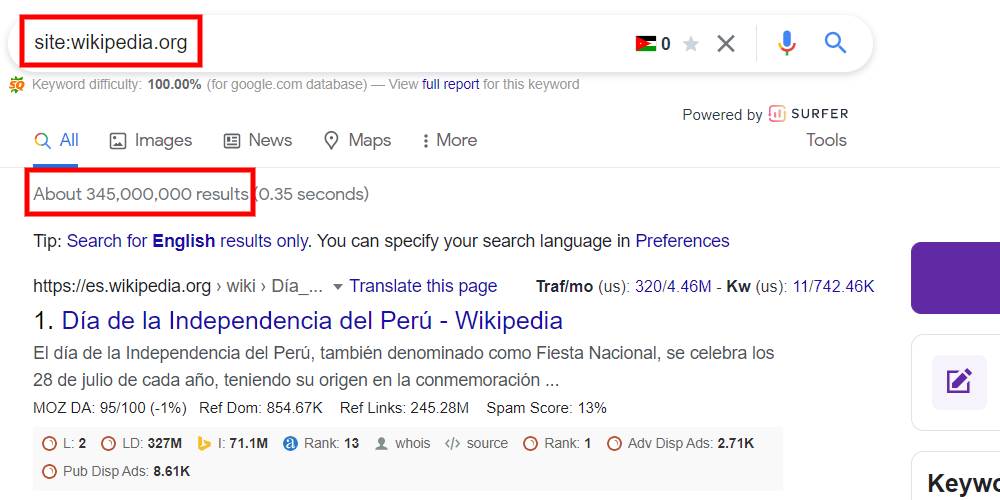
Most SEOs will agree that the "site:" operator is not accurate, and that's true, you can try it by yourself by doing it many times, and you will get different numbers. But still it's a good indicator to tell you how many pages are indexed.
Get the Number of Indexed Pages Using Python, Google Sheets, and Google Data Studio
This tutorial will get the number of indexed pages on Google for each Wikipedia language subdomain using Python, store them in Google Sheets, and visualize the data in a Google Data Studio dashboard.
Setting Up the Google Sheet
Here we will use the Google Sheet as a database to store the data automatically without opening it every time you want to add new numbers.
Go to Google Sheets and create a new blank sheet, and give it "indexed_pages" name.
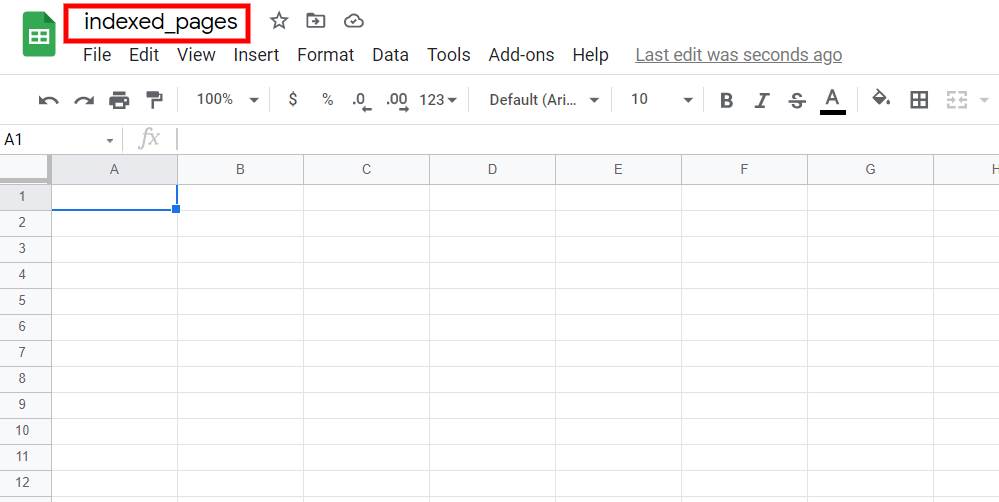
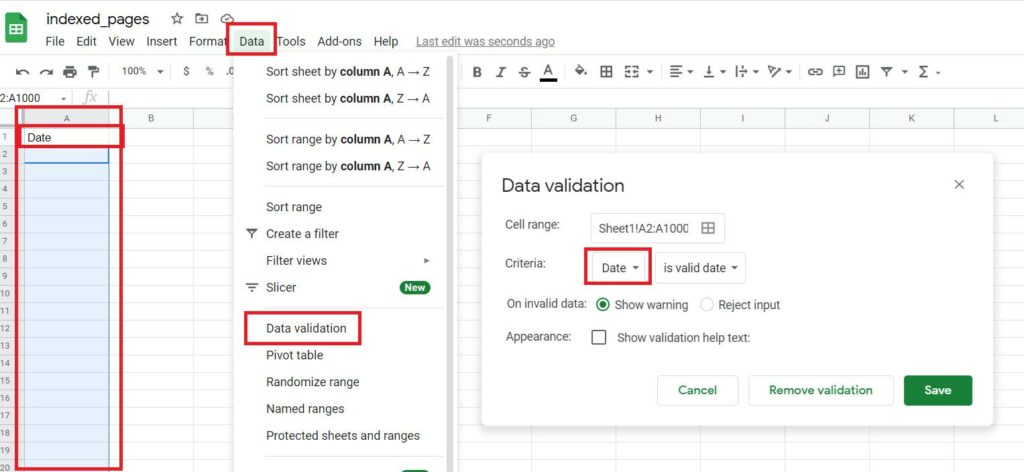
The first column will be used to store the Date, so we need to name the column's header "Date" and change the format of the cells to Date by selecting the entire column without the first cell, and navigate to Data -> Data Validation, and choose Date from the list.
Then we need to add the websites that we want to track by adding each one in a column. In this tutorial, we'll be tracking the below sites:
- ar.wikipedia.org
- es.wikipedia.org
- ru.wikipedia.org
- zh.wikipedia.org
- pt.wikipedia.org
- it.wikipedia.org
- fr.wikipedia.org
- de.wikipedia.org
- ja.wikipedia.org
- en.wikipedia.org
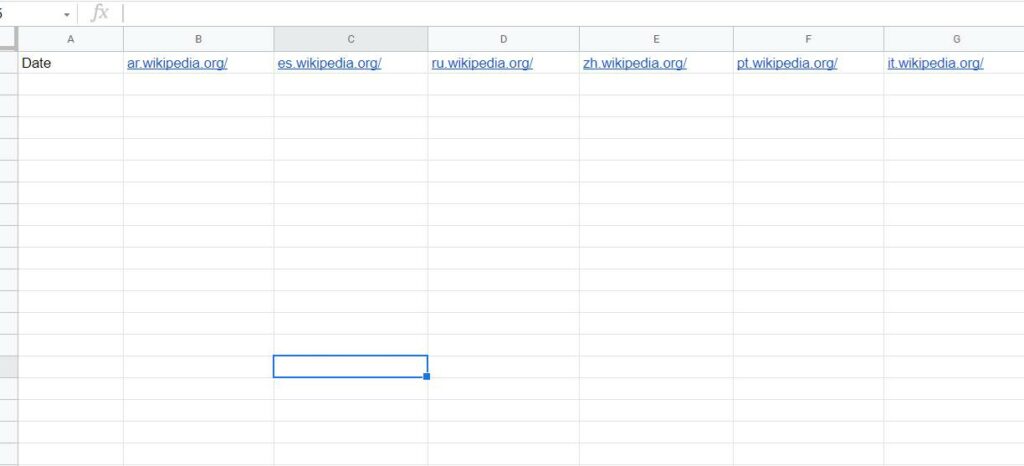
Remove the HTTPS:// and the subdomains before adding them to the sheet. By doing this, you will track the entire domain. In this tutorial, we will keep the subdomains to track the different languages for Wikipedia.
Now is the time to prepare our Python code to scrape the results from Google SERPs and store them in Google Sheets by using the gspread library.
How to Use Gspread Library in Python to Connect With Google Sheets
Gspread is Python API used to connect your script with Google Sheets, where you can add, edit and retrieve data.
To use gspread, you need to get an API key from Google Cloud Services. This API will allow your script to interact with any Google Sheets stored on your drive.
How to get API access to Google Sheets
- Go to Google Cloud and sign in with your Gmail account.
- Go to APIs & Services
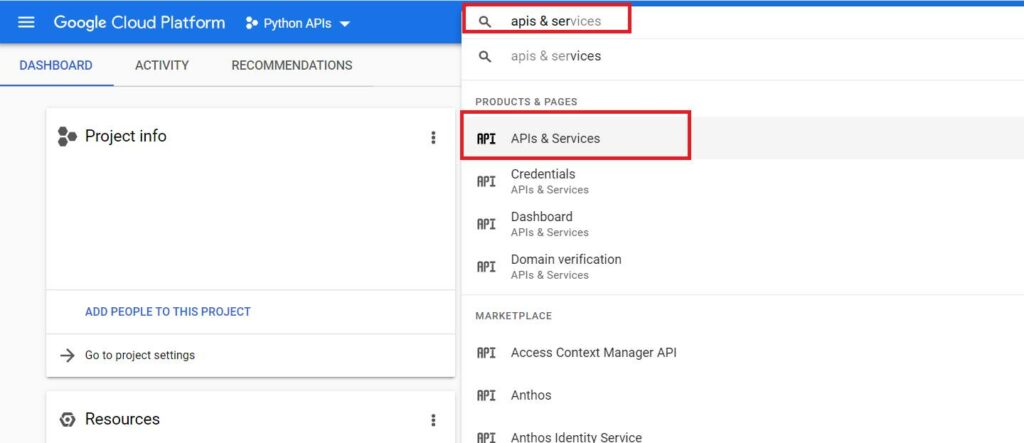
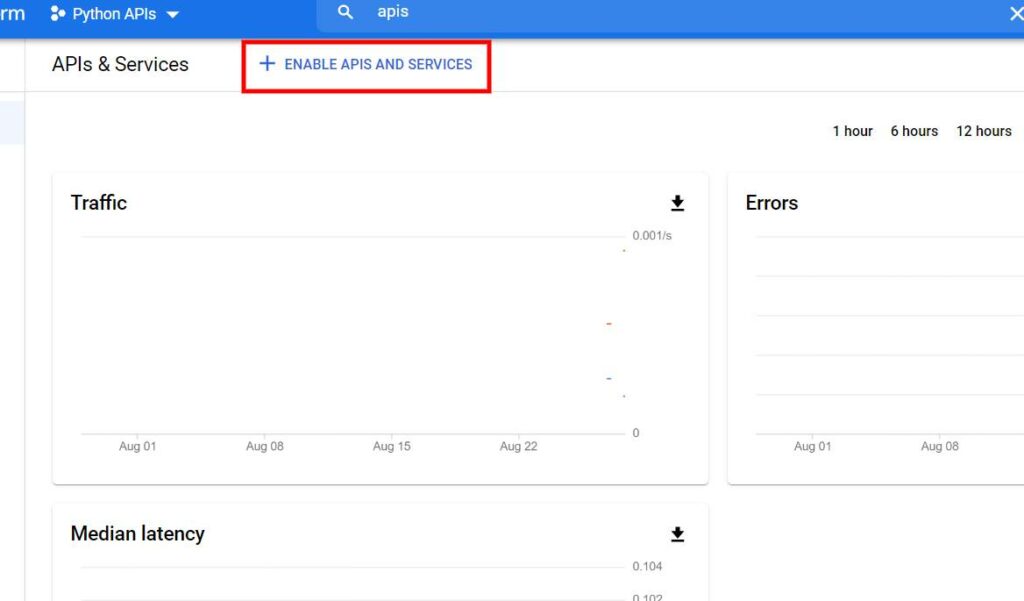
- Then click on Enable APIs and Services
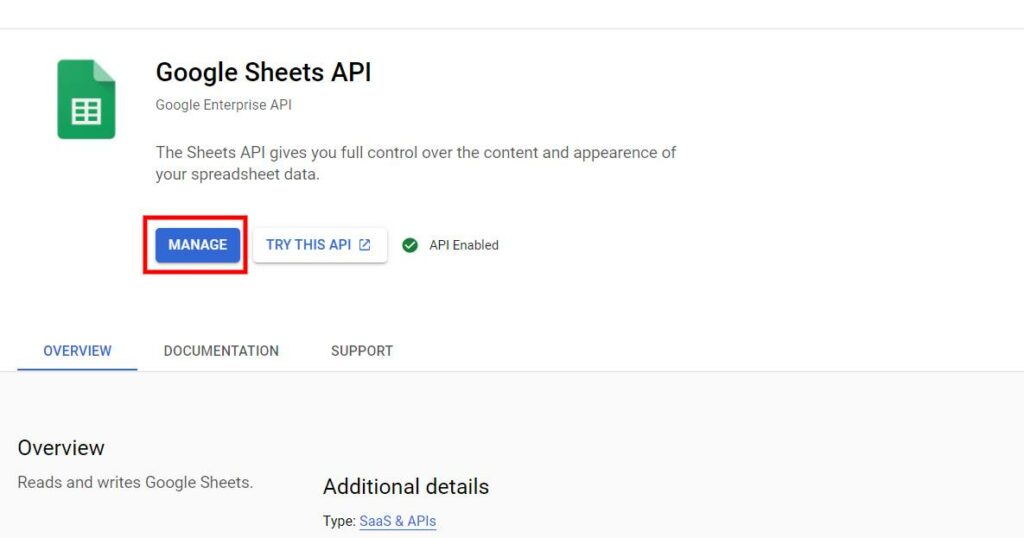
- Search for Google Sheets API, click on it, then enable it.
- Go to Manage
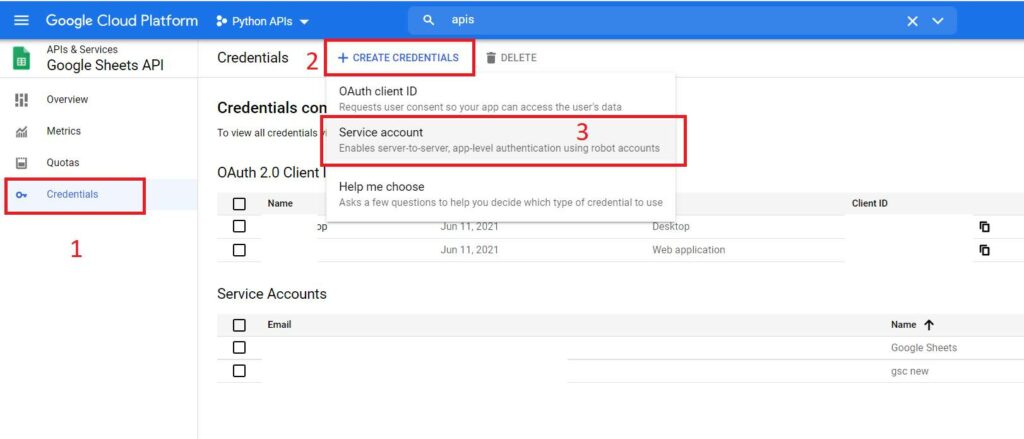
- Go to credentials, then create credentials and choose Service Account
- Fill the service account name and description with anything you want and click on create and continue
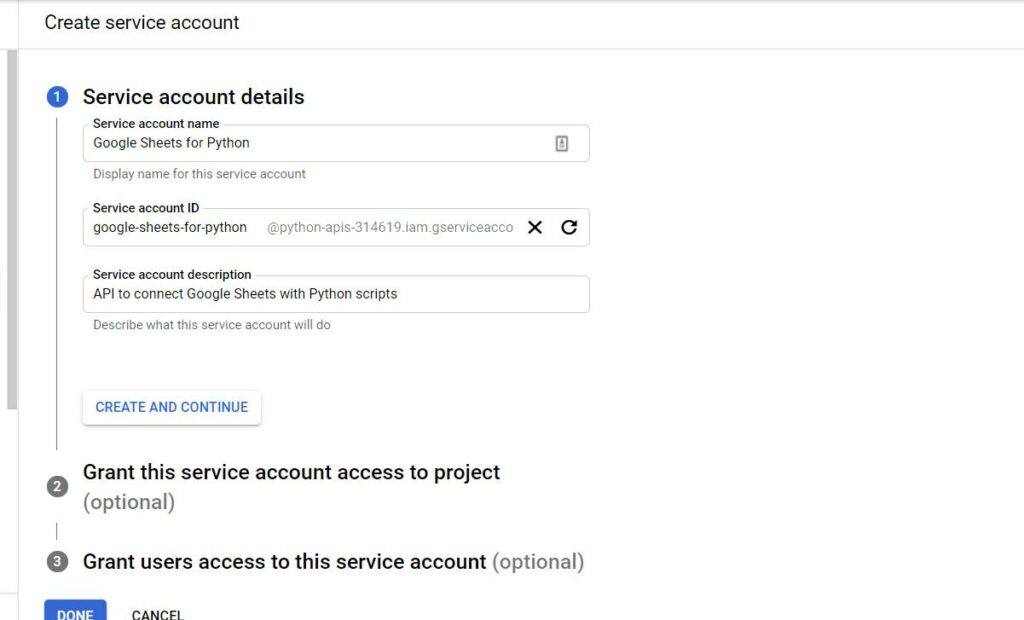
- For roles, select current user and owner, then click on done.
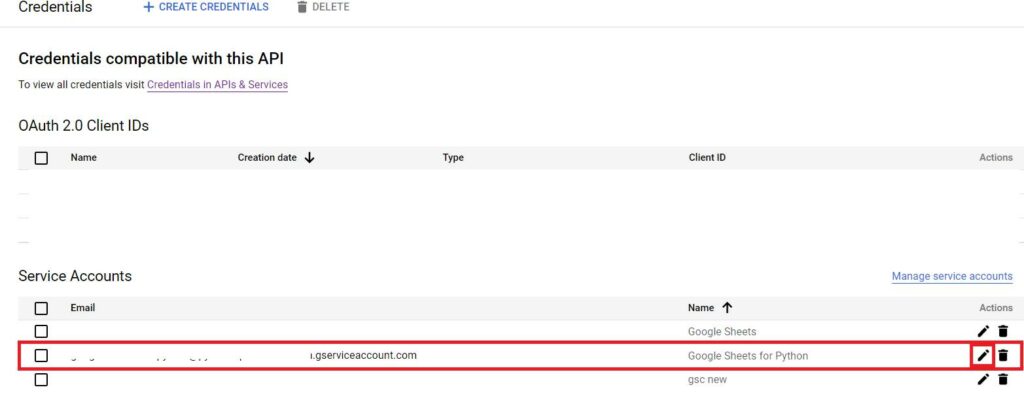
- Click on edit
- Then go to Keys, Add Key, Create a new key and choose JSON.
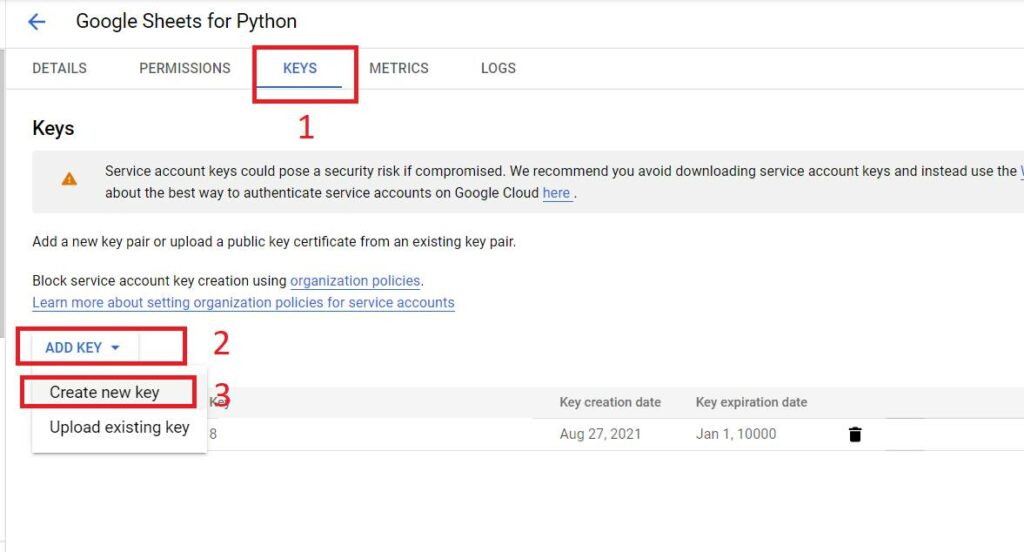
Then, a file will be downloaded to your computer. This file will be used to connect our Python script to Google Sheets.
Grant Access to Your Script on Google Sheets
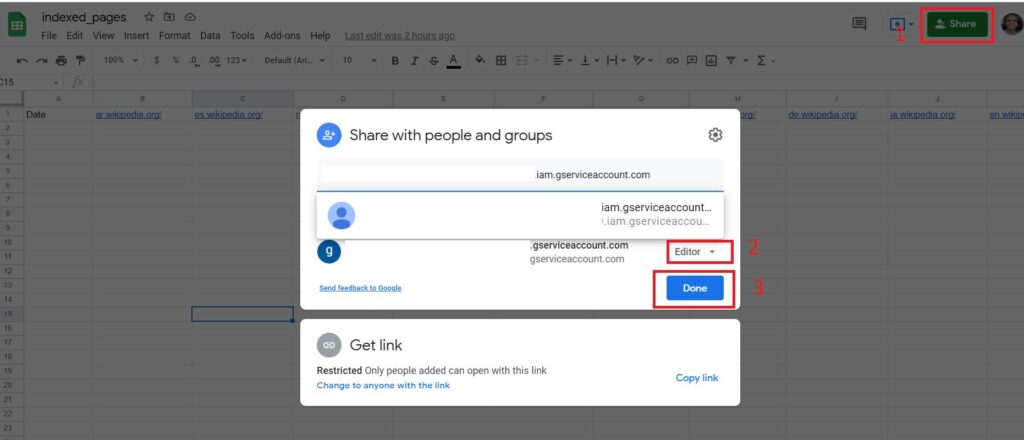
In the JSON file; you will find an email called client_email. Take this email address and go to your Google Sheets and add this email as editor.
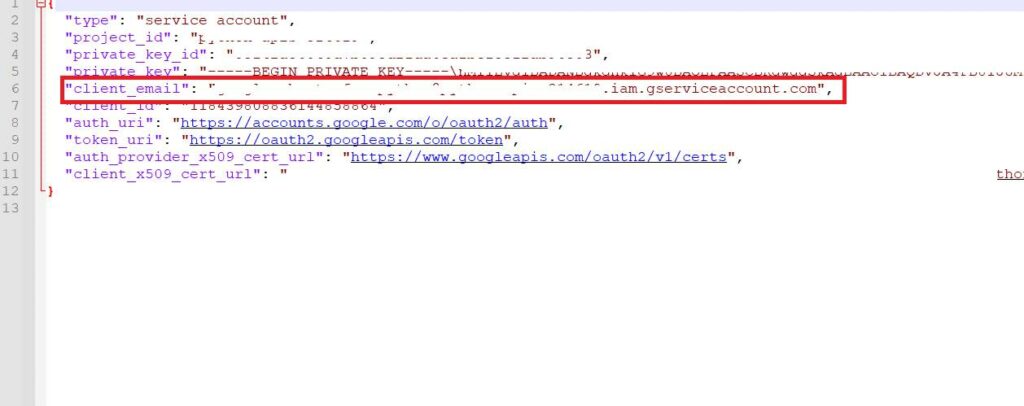
Grant access to the email on Google Sheets
Now take the JSON file to your Python script working directory and rename it to client_secret.json.
Keep the JSON key file in a safe place, don't share it with anyone.
Importing the Python Libraries
We will be using the below libraries in our script to connect to Google Sheets and scrape the data from Google SERPs.
import gspread
from oauth2client.service_account import ServiceAccountCredentials
import requests
from bs4 import BeautifulSoup as bs
from time import sleep
from tqdm.notebook import tqdm
from datetime import date
You can install any missing library by going to your cmd, then type pip install library name, example: pip install gspread.
Define the scope and the authorization
scope = ['https://spreadsheets.google.com/feeds','https://www.googleapis.com/auth/drive']
creds = ServiceAccountCredentials.from_json_keyfile_name('client_secret.json', scope)
client = gspread.authorize(creds)
Open the Google Sheet
sheet = client.open('indexed_pages')Replace "indexed_pages" with the name of your sheet.
Get the worksheet
sites_sheet = sheet.get_worksheet(0)Get the values of the sheet in a list
data_sheet_header = sites_sheet.spreadsheet.worksheet("data").get_all_values()Get the list of the domains
domains = data_sheet_header[0][1:]Perform a request on Google SERPs and scrape the data
final_index_list = []
ua = "Mozilla/5.0 (Windows NT 10.0; Win64; x64) AppleWebKit/537.36 (KHTML, like Gecko) Chrome/91.0.4472.77 Safari/537.36"
for url in tqdm(domains):
    google_serp_url = f"https://www.google.com/search?q=site:{url}&hl=en"
    google_request = requests.get(google_serp_url,headers={"User-Agent":ua})
    google_html = bs(google_request.text,"html.parser")
    indexed_pages = google_html.find(id="result-stats")
    final_index_list.append(indexed_pages.text.split()[1])
    sleep(2)
Here, I have added 2 seconds delay between each request to avoid getting blocked by Google.
Get the current Date and add it to the results list
today = date.today()
final_index_list.insert(0,str(today))
Insert the results into our Google Sheets
sites_sheet.append_row(final_index_list,"USER_ENTERED")Now go to your Google Sheet, and you will find the results updated automatically without touching it.
You can perform this task every day automatically by using a cron job on your server. The results will be saved on Google sheets automatically without the need to add them manually.
Connect Google Sheets with Google Data Studio
This is the last step in our tutorial, where we will connect our Google Sheets with Google Data Studio to create a small dashboard to display the results
- Go to Google Data Studio and create a new blank report. For the data source, choose Google Sheets.
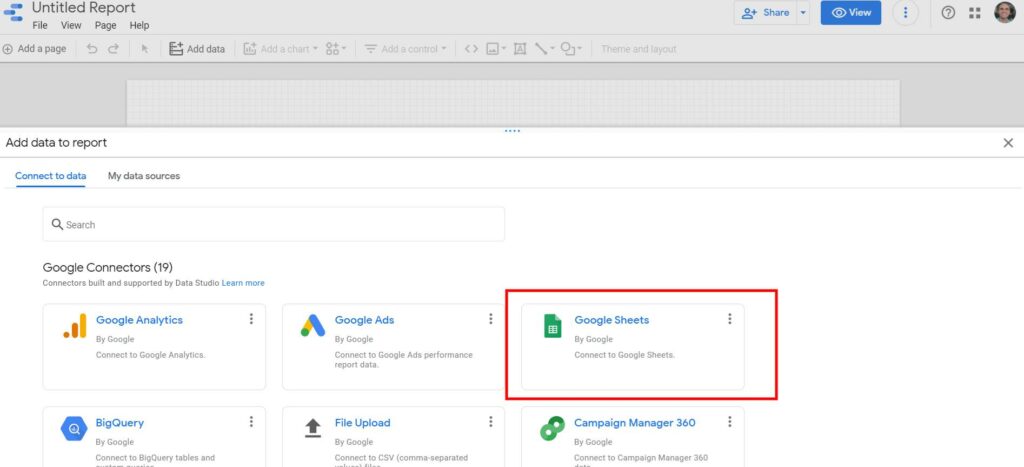
- Now choose your sheet and click on Add.
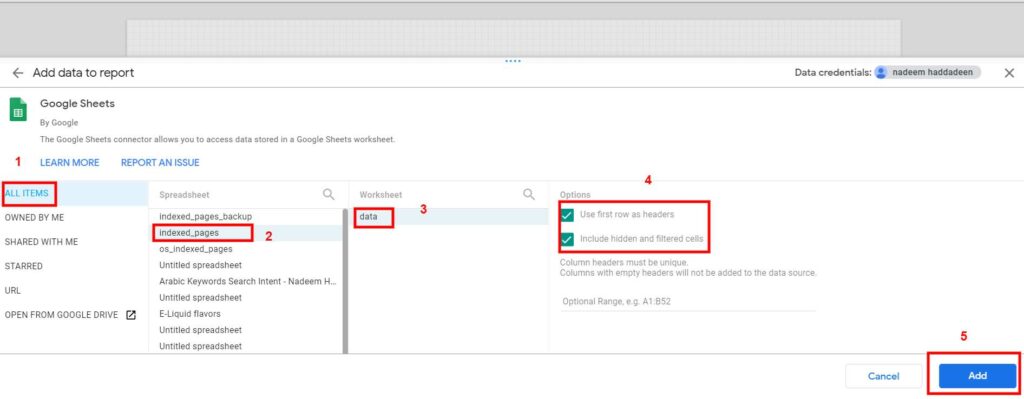
- From Add a Chart, choose a time series chart.
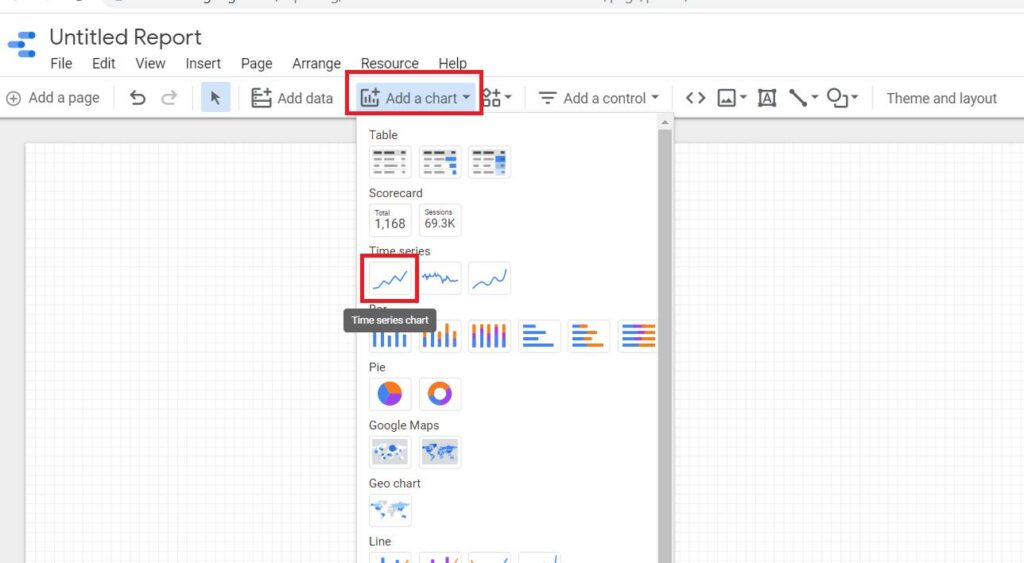
- Under metrics, add all the websites, and keep Date Range and Dimension to Date.
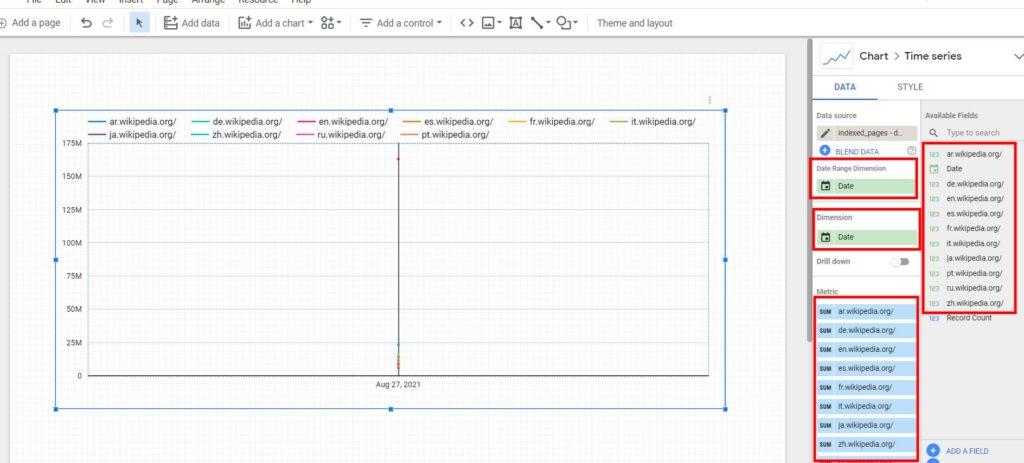
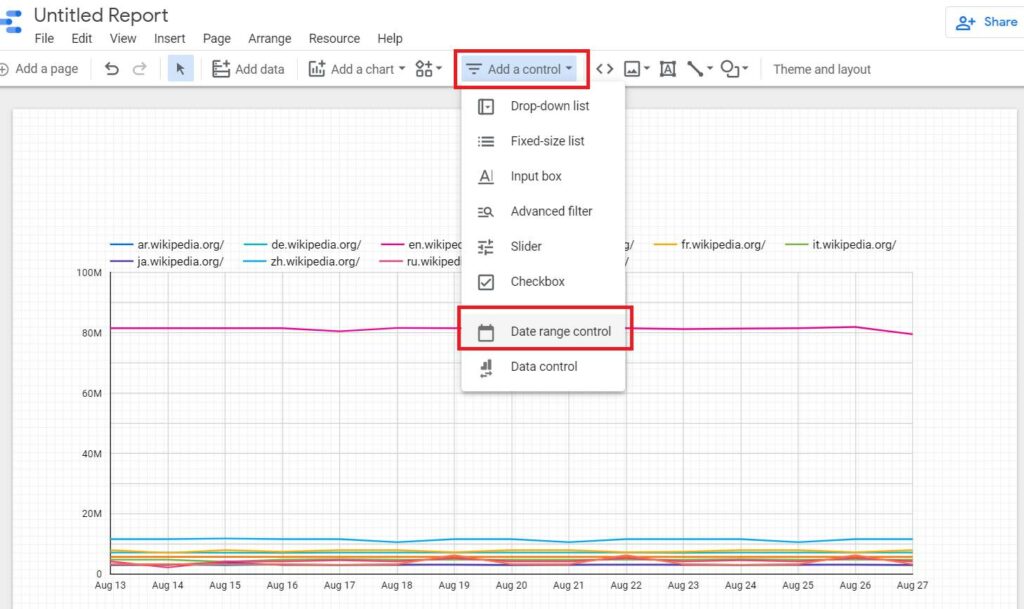
Then we will add a Date Range Control to give us the ability to filter the dates that we want to show on the chart.
Click on Add a Control, and choose Date Range Control.
And that's it, now you can view your report and share it with your manager or client.
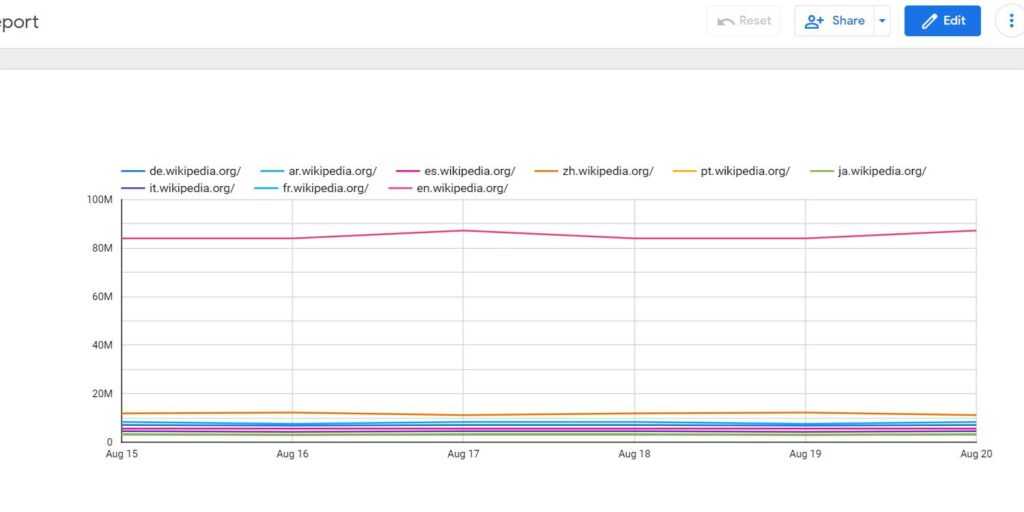
Google Data Studio gives you the ability to create complex reports by combining data from Google Sheets, Google Search Console, Google Analytics, MySQL, and other resources.
If you are looking for a more advanced SEO Dashboard, contact me on my Linkedin profile.
You can start from here to build your own SEO Dashbarod for your technical SEO audit or content and share it with your team.


